South San Francisco CA August 22, 2016 Submitted by Michael Harris
Originated: Jorge Villalobos, Labor Market Consultant, Labor Market Information Division, Employment Development Department
I have attached the latest unemployment and industry jobs data. Our next local area press release is scheduled for September 16, 2016. You can find the schedule for releases at http://www.labormarketinfo. edd.ca.gov/LMID/Data_Release_ Schedule.html.
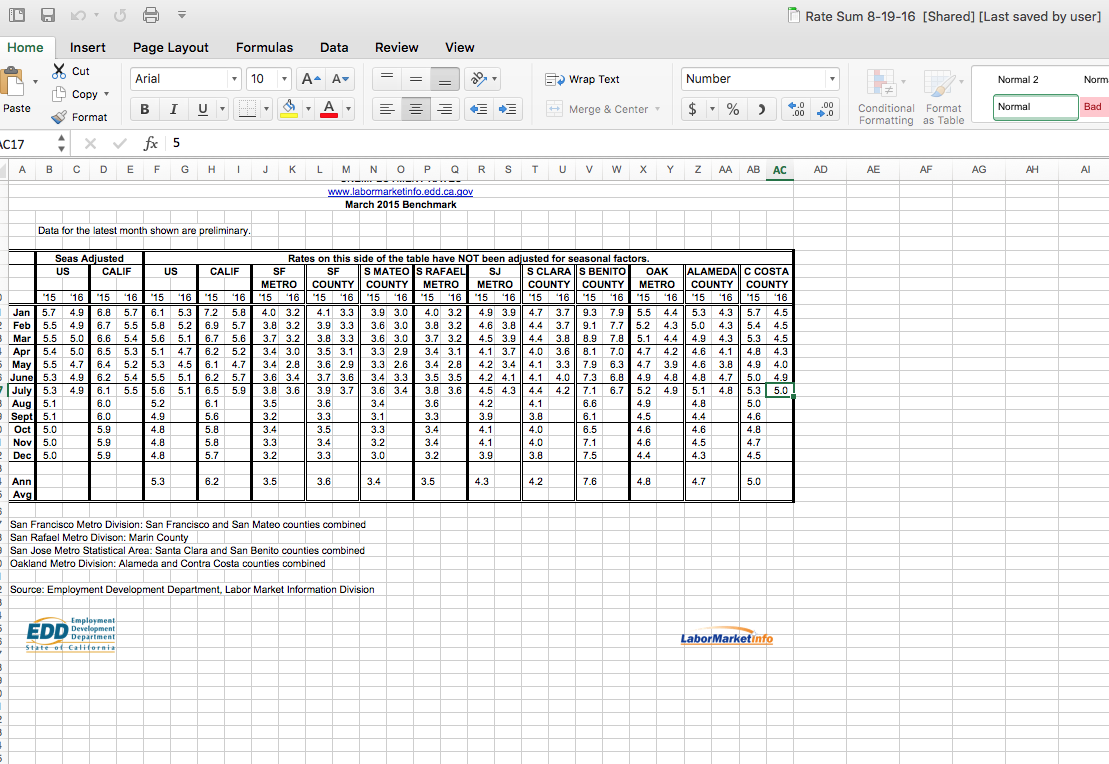
The unemployment rate in San Mateo County was 3.4 percent in July 2016. This compares with an unadjusted unemployment rate of 5.9 percent for California and 5.1 percent for the nation for this July. San Mateo County registered the lowest unemployment rate among California’s 58 counties as of July 2016.
Did you know that gasoline prices were down in the Bay Area by nearly 66 cents in July compared to year-earlier figures? Or that workers in the San Francisco metropolitan area earn about 51 percent above the national average? We invite you to explore recent news releases on Average Energy Prices and Occupational Employment and Wages from the Western Information Office of the Department of Labor’s Bureau of Labor Statistics (BLS).
Headwaters Economics, a Montana-based nonprofit, provides an easy-to-use tool to assess Populations at Risk (PAR). Looking at subjects such as young and elderly populations, race and ethnicity, educational attainment, individuals and families in poverty, and more, it uses American Community Survey data to create reports about populations at risk for adverse social, health, or economic outcomes. Each subject includes explanations under the headings “What do we measure on this page?” and “Why is it important?” To begin, choose “Select from List” on the right side of the page above the map. Then select California and your county.
The Employment Development Department (EDD) released the data included in this e-mail earlier today. These data, as well as other employment and unemployment statistics, will be available on the EDD Internet site at www.labormarketinfo.edd.ca.gov later today. If you need assistance obtaining additional data, feel free to contact me.
Jorge Villalobos
Labor Market Consultant
Labor Market Information Division, Employment Development Department
745 Franklin Street
San Francisco, CA 94102
Phone: 415-749-2002 Fax: 415-749-2003
ATTACHED:
San Francisco-REDWOOD CITY-SOUTH SAN FRANCISCO METROPOLITAN DIVISION (San Francisco and San Mateo counties)
Most major industry groups experienced year-over job gains
The unemployment rate in the San Francisco-Redwood City-South San Francisco MD was 3.6 percent in July 2016, up from a revised 3.4 percent in June 2016, and below the year-ago estimate of 3.8 percent. This compares with an unadjusted unemployment rate of 5.9 percent for California and 5.1 percent for the nation during the same period. The unemployment rate was 3.7 percent in San Francisco County, and 3.4 percent in San Mateo County.
Between June 2016 and July 2016, the total number of jobs in the San Francisco-Redwood City-South San Francisco MD, which includes the counties of San Francisco and San Mateo, increased by 1,300 jobs to total 1,084,900.
- Professional and business services added 4,700 jobs, far better than its average gain of 2,500 jobs between June and July over the prior 10 years.
- Financial activities, as well as trade, transportation, and utilities, expanded by 600 jobs each.
- Construction picked up 500 jobs over the month.
- Meanwhile, public and private schools decreased by 4,700 jobs seasonally, as schools scaled back operations for the summer.
- Leisure and hospitality fell by 1,500 jobs.
- Other services experienced a net loss of 500 jobs.
Between July 2015 and July 2016, the total number of jobs in the counties of San Francisco and San Mateo increased by 27,100 jobs, or 2.6 percent.
- Professional and business services led the year-over gains with a net addition of 12,000 jobs. Computer systems design and related services (up 6,300 jobs) accounted for the majority of the gain.
- Private educational and health services climbed by 5,700 jobs over the year.
- Government rose by 2,900 jobs, while construction expanded by 2,600 jobs.
- Leisure and hospitality scored a 1,900-job gain.
- Trade, transportation, and utilities advanced by 1,400 jobs, mostly in retail trade (up 1,200 jobs).
- On the down side, financial activities and manufacturing cut back 300 jobs each
###
